(BANKNIFTY WEEKLY CHART)
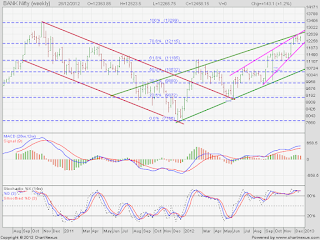
In above weekly chart one can see the channel and rising wedge pattern. Banknifty has resisted near the top of channel and rising wedge pattern.
This week banknifty traded sideline within the wedge whereas the Weekly MACD still in bullish tone and stochastic too overbought and in bullish territory. In short, yet there is no weakess in weekly chart.
This week banknifty traded sideline within the wedge whereas the Weekly MACD still in bullish tone and stochastic too overbought and in bullish territory. In short, yet there is no weakess in weekly chart.
For next week channel top and wedge top resistance comes around 12720---12780 whereas on downside wedge support comes around 12050--12100 and 78.6% retracement level of 13303 to 7766 comes around 12115.
When Rising Wedge pattern is found in an uptrend, it is considered a reversal pattern, as the contraction of the range indicates that the uptrend is losing strength.
To read more on 'Rising Wedge Pattern' click the given link :
============================================
There is no need to trade everyday...
'Trade Less Trade Smart'
WITH
JUST BANKNIFTY

Comments
Post a Comment