Everyday Banknifty is making new low and lower high. Yesterday banknifty had tested 200 Week EMA @ 9080 but manage to close above it and it should be protected this week end also otherwise there will be more bearishness. Still it is trading within triangle and downward channel and made a hammer candlestick pattern.
Today banknifty has support around 9050-9100 zone and resistance around 9285-9350 zone.
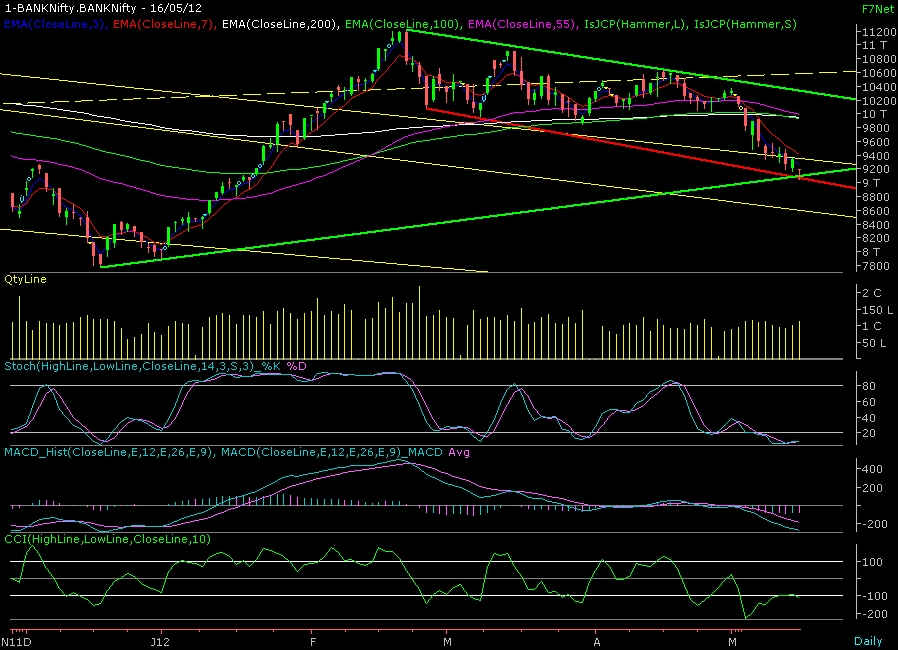
(Daily Chart)
HAMMER CANDLESTICK PATTERN

Hammer has small real bodies (black or white), long lower shadows and short or non-existent upper shadows. The Hammer is a bullish reversal pattern that forms after a decline. In addition to a potential trend reversal, hammers can mark bottoms or support levels. After a decline, hammers signal a bullish revival. The low of the long lower shadow implies that sellers drove prices lower during the session. However, the strong finish indicates that buyers regained their footing to end the session on a strong note. While this may seem enough to act on, hammers require further bullish confirmation. Such confirmation could come from a gap up or long white candlestick.
Comments
Post a Comment